
The Xero Business Performance dashboard contains numerous financial ratios and KPI’s. However they can be somewhat hidden if you don’t know how to access them.
To access the Xero Business Performance dashboard, click Reports, All Reports, and type in the search field on the right, start typing in Business Performance (it’s under the Financial menu), until you see the report. Once you see the report select it, and it opens.
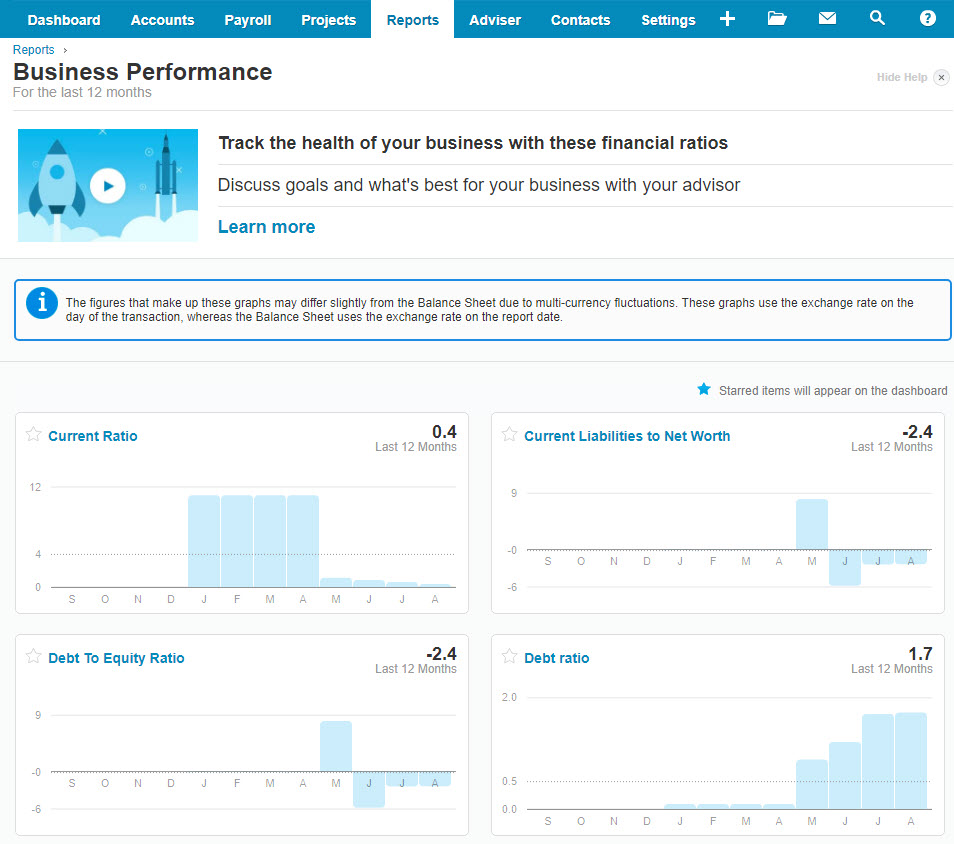
The top section is deemed standard ratios, and below, are advanced ratios. If you can not see the following advanced ratio’s you need to ask a Xero partner to turn them on.
Accounts Payable Days
Accounts Receivable Days
Average Payment Period
Creditors Turnover
Current Liabilities to Inventory
Current Liabilities to Net Worth Ratio
Current Ratio
Debt Ratio
Debt Service Coverage Ratio
Debt to Equity Ratio
Fixed Assets to Net Worth Ratio
Gross Profit %
Inventory Turnover Ratio
Management Rate Return %
Net Operation Profit Rate Return %
Net Profit on Net Sales %
Quick Ratio
Retained Earnings to Total Assets %
Return on Capital Employed %
Return on Investment %
Times Interest Earned
Working Capital to Total Assets %
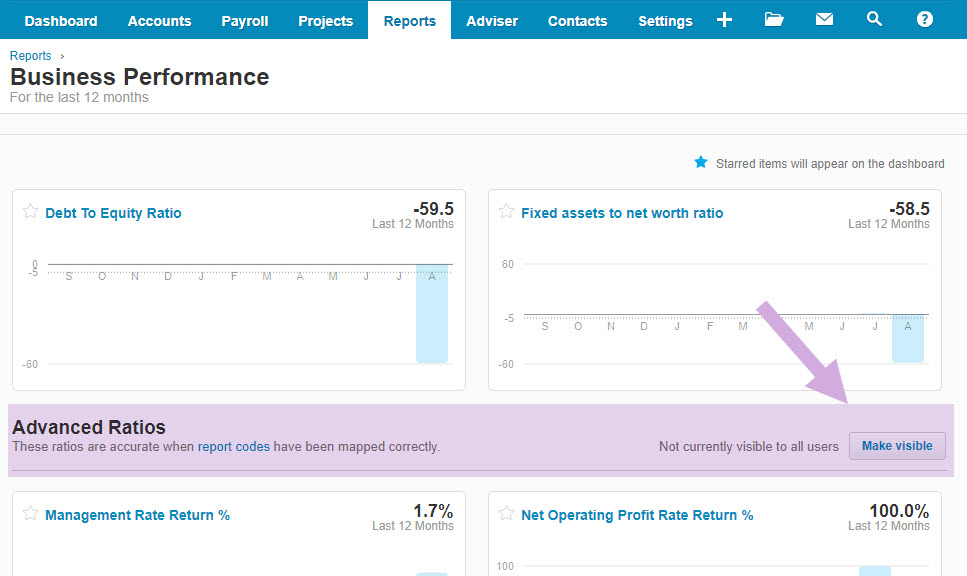
Here’s an image of the Business Performance dashboard. I’ve trimmed out some lines, so it is a compacted version. I am highlighting that as a Xero Partner, you have access to activate Advanced Ratios. Click the button labelled Make visible to display the Advanced Ratios.
I created a series of videos explaining individual ratios on the Business Performance dashboard. Here is the Current Ratio video. You can view more of them on my YouTube channel.
For the ratio calculations on the Business Performance dashboard to work properly, transactions need to be accurately coded to the correct account type. (found under Settings > General Settings>Reports>Report Codes). If your accounts are not mapped correctly, or you do not have certain elements, like inventory or fixed assets, the ratios that require that information do not appear.
I’ve also attached a spreadsheet, to help explain this.
On Sheet 1 is a listing of the Report Code’s and what they reference.
For example: ASS.CUR.INY.WIP is Work in Progress.
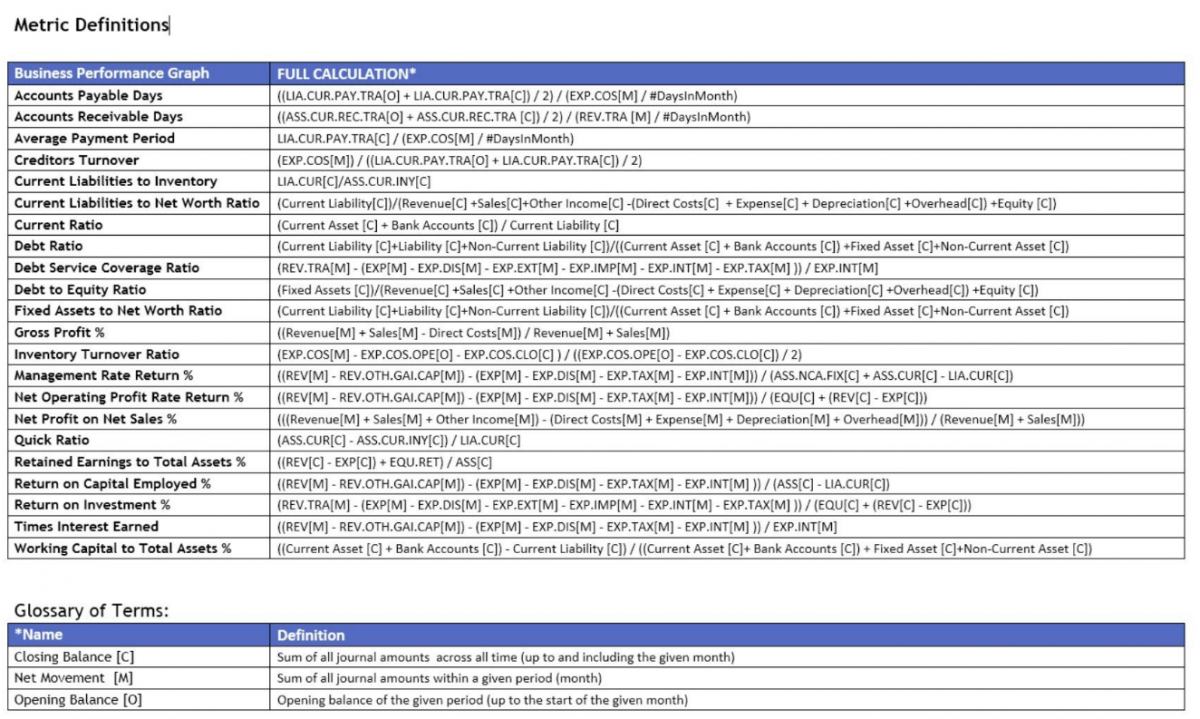
On Sheet 2 is a listing of all the ratio formula’s, with the legend at the bottom of the page. It is a bit confusing and you need to work through it slowly. Here is an example:
Name : Quick Ratio
Formula : (ASS.CUR[C]-ASS.CUR.INY[C])/LIA.CUR[C]
Simple Terms : Current Assets- Current Inventories/Current Liabilities
To appear as a block on the dashboard, the three elements of the formula, need to be linked to an account code.
Let me know if you have questions, and I can revisit this and explain further.
Here is the Business Performance MasterReportCodeList spreadsheet referenced above.